Source: Community Science
Geographic information system (GIS) maps help researchers, policymakers, and community members see how environmental risks are spread throughout a given region. These types of interactive, layered maps can be used for storytelling, education, and environmental activism. When community members are involved in their use and creation, GIS maps can also be a tool for equity.
Lively et al. outlined a project focusing on mapping the features and flooding risks at and around the Tar Creek Superfund site in Ottawa County, Okla. Ottawa County is home to 10 federally recognized Tribal Nations. Residents have experienced decades of health and environmental harm from the region’s legacy of zinc and lead mining, most of which occurred within the Quapaw Reservation. Although mining ceased in 1970, giant piles of mining waste, mine water discharges, and unstable ground have poisoned residents and made entire towns unlivable. For almost a century, floods have spread these contaminants across downstream communities.
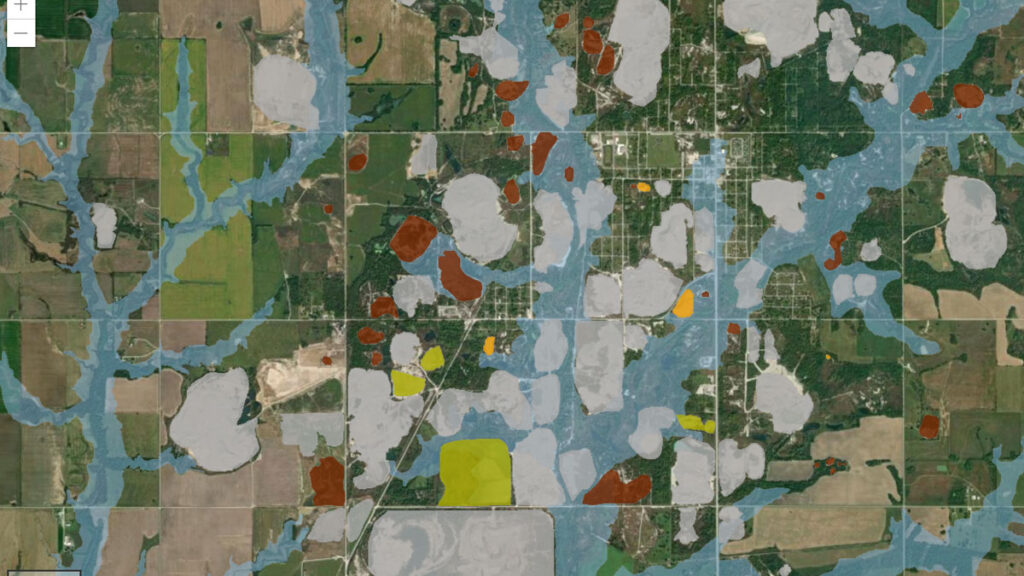
Technical experts and community members with local knowledge worked together to build a GIS map that can be used by community members and leaders. It depicts how floodwaters run through former mining sites, which then ferry toxic waste throughout the region’s creeks and soils.
The map is viewable in various layers that show the locations of different kinds of mining waste, tribal land boundaries, and flood zones designated by the Federal Emergency Management Agency (FEMA). Users can also view layers showing soil types and the locations of aquifers, fault lines, and wells.
Between 2021 and 2023, members of the Local Environmental Action Demanded Agency (LEAD), a community-led organization, connected with GIS professionals through AGU’s Thriving Earth Exchange. This program partners local organizations with volunteer scientists and experts to address environmental or geoscience-related issues in their communities. Many members of the project team contributing to the Tar Creek project were local to the Miami, Okla., region.
Though much of the actual map building was completed by the GIS expert team member, decisions on what to include in each layer of the map were made by LEAD representatives and nonscientist community members. This coproduction defined equity not only by who built or contributed to the map but also by how it is used by the community as a key storytelling tool—helping to educate officials and residents about the ongoing environmental and health risks when flooding occurs in the region. For the team, it was important not to just make the map but also to use it: Production without activism, the researchers said, would make for an unfinished project. (Community Science, https://doi.org/10.1029/2024CSJ000077, 2026)
—Rebecca Owen (@beccapox.bsky.social), Science Writer

Citation: Owen, R. (2026), Making a map to make a difference, Eos, 107, https://doi.org/10.1029/2026EO260035. Published on 11 February 2026.
Text © 2026. AGU. CC BY-NC-ND 3.0
Except where otherwise noted, images are subject to copyright. Any reuse without express permission from the copyright owner is prohibited.