The primary role of geostationary satellites, which orbit in sync with Earth’s rotation and remain in relatively fixed positions roughly 36,000 kilometers above the planet’s surface, has traditionally been to provide vital observations for weather forecasting. Now they are emerging as powerful tools for monitoring other conditions at Earth’s land surface as well.
Satellites such as the Geostationary Operational Environmental Satellites–R (GOES-R) series, Himawari-8 and -9, Fengyun-4 (FY-4), and the Geostationary Korea Multi-Purpose Satellite–2A (GK-2A) offer rare capabilities for near-real-time observations across large scales. By providing observations at intervals of 5–15 minutes, they offer a temporal resolution far superior to polar-orbiting or low-Earth-orbit satellite sensors like the Moderate Resolution Imaging Spectroradiometer (MODIS) and Sentinel-2’s Multispectral Imager. Those sensors typically capture infrequent snapshots of a given part of the land surface, one or two per day in the case of MODIS or once every 5 days in the case of Sentinel-2.
With their fine-grained coverage, geostationary satellites are uniquely powerful for high-frequency land surface monitoring.
With this fine-grained coverage, they are uniquely powerful for high-frequency land surface monitoring, resolving diurnal and seasonal ecosystem dynamics, and enabling early warning and more effective tracking of rapid surface changes like wildfires, floods, frosts, and heat waves. They can also help support protection of tropical forests and inform carbon neutrality strategies, among other applications.
The past 5 years have seen rapid progress in the use of geostationary satellites for studies of land ecosystems at fine timescales. At the same time, land surface data product streams from multiple geostationary platforms have been steadily maturing and are increasingly available for applications.
Here we discuss examples in which these high-frequency observations have been used to improve land monitoring, as informed by expert discussions at a recent international workshop, and we explore opportunities for scientists and decisionmakers to continue harnessing their potential.
Novel Insights into Ecosystem Processes
The high-frequency observations from geostationary platforms offer satellite data at an unprecedented temporal resolution with which to examine ecosystem processes. In the Asia-Pacific region, the Himawari-8 and -9 satellites collect up to 25,000 observations per year—or nearly 70 snapshots per day on average across the region (Figures 1a and 1b)—about 100 times the sampling of the polar-orbiting MODIS. Meanwhile, the Himawari sensors’ spatial resolution (~1 kilometer) is comparable to that of MODIS (~500 meters).
This cadence resolves subdaily dynamics that polar-orbiting sensors often miss. In recent work, for example, Himawari-8 and -9 data on land surface temperatures (LST) and solar radiation at 18 sites in Japan and South Korea informed a model that captured the midday depression of photosynthesis, whereas a MODIS-based model limited to two daily snapshots did not (Figure 1c) [Yamamoto et al., 2025]. Similarly, GOES-R detected a widespread midday suppression of photosynthesis during dry days in North America, contrasting with the conventional assumption that photosynthesis peaks at midday along with solar radiation.
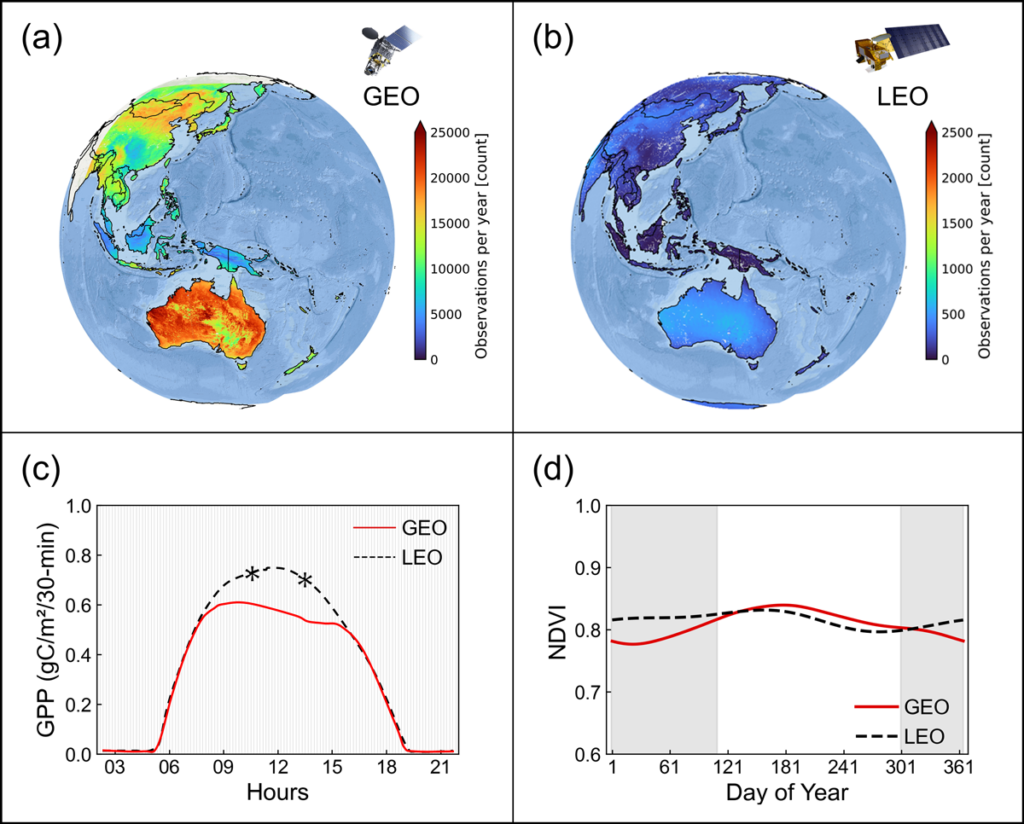
The explanation for this suppression is not entirely clear, though it may relate to plants coping with higher vapor pressure deficits around midday; regardless of the reasons, it has profound implications for gross primary productivity. Together these results show how geostationary satellites complement polar-orbiting satellites by filling diurnal data gaps [Xiao et al., 2021] and how they sharpen our view of ecosystem processes under heat and moisture stress.
Geostationary satellites collect images many times per day, increasing the odds of cloud-free looks.
Geostationary satellite observations are also opening the tropics, which include the planet’s most carbon-dense and biodiverse land regions, to more frequent monitoring. Persistent cloud cover, especially in rainy seasons, has long hampered satellite views in the tropics; with their infrequent revisits, polar-orbiting sensors are more likely to return cloud-contaminated scenes. In contrast, geostationary satellites collect images many times per day, increasing the odds of cloud-free looks. On average, for example, MODIS provides clear, cloud-free observations over tropical Asia on only 40% of the days, compared with 80% for Himawari-8 [Tian et al., 2025].
Leveraging this high-frequency cadence, recent studies using GOES-R and Himawari-8 and -9 have resolved seasonal dynamics of tropical forests in the Amazon and Southeast Asia [Hashimoto et al., 2021; Tian et al., 2025]. For example, these studies have clearly observed the green-up of evergreen broadleaf forests in dry seasons, informing long-running debates about whether and why such green-ups occur (Figure 1d).
Rapid and Real-Time Land Disturbance Monitoring
Geostationary observations also allow rapid and continuous monitoring of disturbances and hazards. Many such disturbances are too ephemeral to be detected routinely by polar-orbiting satellites.
Researchers recently used geostationary observations to track the development of short-term disturbances, including flash droughts [Losos et al., 2025], landslides [Miura and Nagai, 2020], and tropical storms [Losos et al., 2025]. Others used GOES-R series data to produce near-real-time hourly estimates of wildfire emissions in fire-prone high-latitude North America, providing valuable information to support regional air quality forecasting where such data were previously unavailable [Li et al., 2025].
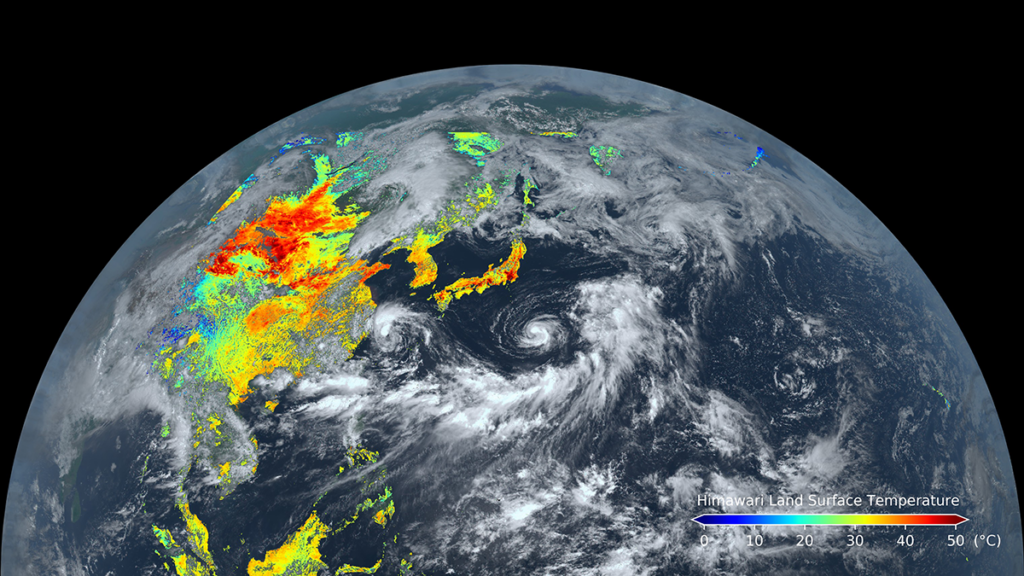
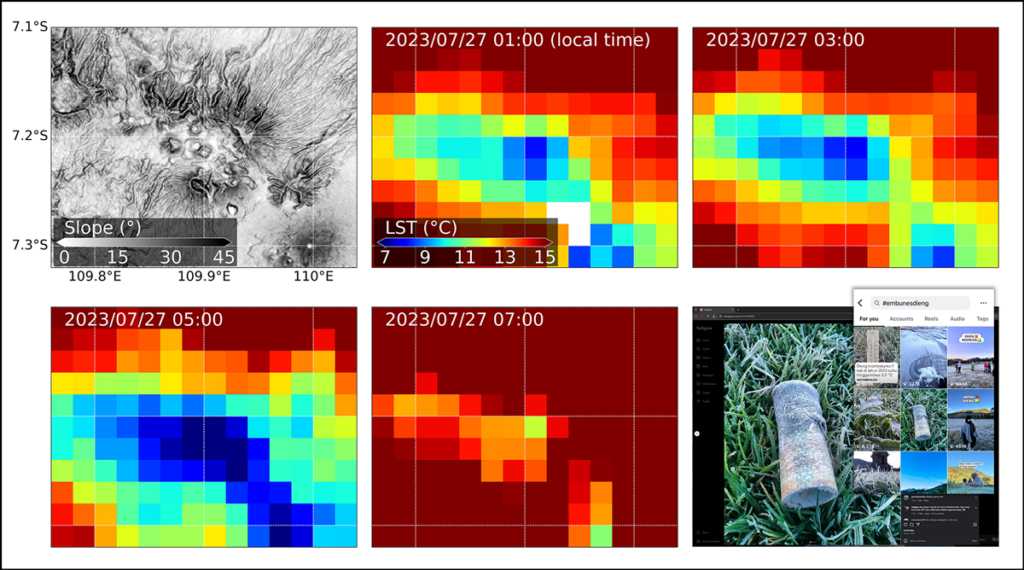
A case study reported during the recent workshop offers another illustration. Using Himawari-8 and -9 LST measurements, researchers monitored nighttime pooling of cold air over Indonesia’s Dieng Plateau and flagged incipient frost events that threatened potato fields. Alerts based on satellite observations taken every 10 minutes and cross-checked against local reports of frost events on Instagram offered growers timely advance cues of threats (Figure 2).
This sort of nowcasting shows how high-frequency data—in this case, thermal data—from geostationary satellites can be applied directly in actionable local decisionmaking about agricultural and disaster mitigations.
Emerging Opportunities and Ongoing Challenges
Researchers have moved quickly in recent years to realize the promise of geostationary observations for land monitoring by processing and providing critical land surface data products.
Researchers have moved quickly in recent years to realize the promise of geostationary observations for land monitoring by processing and providing critical land surface data products from multiple platforms. Himawari-8 and -9 now provide high-quality LST and land surface reflectance (LSR) data at a data portal hosted by Chiba University. LST and LSR products from FY-4 are available from the National Satellite Meteorological Center and Lanzhou University, respectively. And the GOES-R series offers LSR data via NOAA.
LSR data from these sources have been used to derive vegetation indices, such as the normalized difference vegetation index (Figure 1d), for use in phenological studies and to monitor other quick ecosystem changes [Hashimoto et al., 2021; Tian et al., 2025; Zhao et al., 2022]. They have even been used to create the ALIVE (Advanced Baseline Imager Live Imaging of Vegetated Ecosystems) framework to provide information on critical ecosystem functions, such as terrestrial photosynthesis and evapotranspiration, at 5-minute intervals [Losos et al., 2025].
Scientists are also finding innovative ways to fuse geostationary satellite data products with those from other satellite sensors, such as combining GK-2A vegetation indices with solar-induced fluorescence data from the Orbiting Carbon Observatory–3 [Jeong et al., 2024]. Other researchers have fused LSR observations from GOES-R and the Visible Infrared Imaging Radiometer aboard the Suomi satellite [Gao et al., 2025; Li et al., 2025]. Such studies are yielding new constraints on photosynthetic carbon uptake rates, as well as on ecologically and societally important changes in phenology and biomass.
Despite this momentum, geostationary land remote sensing is still in its infancy, and there are challenges to expanding its use. Producing accurate data requires robust calibration and validation procedures. For example, surface reflectance data must be corrected for angular effects and parallax effects because of the very large viewing angles of geostationary satellite sensors. These effects can create challenges for using current radiative transfer models, which simulate the propagation of electromagnetic radiation in the atmosphere and within canopies.
Another challenge is that even when datasets for land surface monitoring are produced, bottlenecks can occur in their delivery to users. The volumes of subhourly data collected by geostationary satellites are enormous, yet their distribution still relies—in some cases—on legacy file transfer tools like FTP (file transfer protocol) or ad hoc web portals, with limited integration into cloud platforms like Google Earth Engine. (NOAA’s cloud-based distribution of GOES-R data is an exception.) These bottlenecks not only slow research on data processing and land surface product development but also limit applications by downstream users.
Also, geographic coverage and usage of geostationary satellite data are not evenly distributed. Each satellite views a fixed hemisphere, meaning applications of their data tend to be regional (Figure 3). Furthermore, differences in satellite sensors, viewing geometries, and data processing pipelines continue to complicate interoperability among different data products, although NASA’s GeoNEX collaboration platform is an important step toward harmonization [Wang et al., 2020].
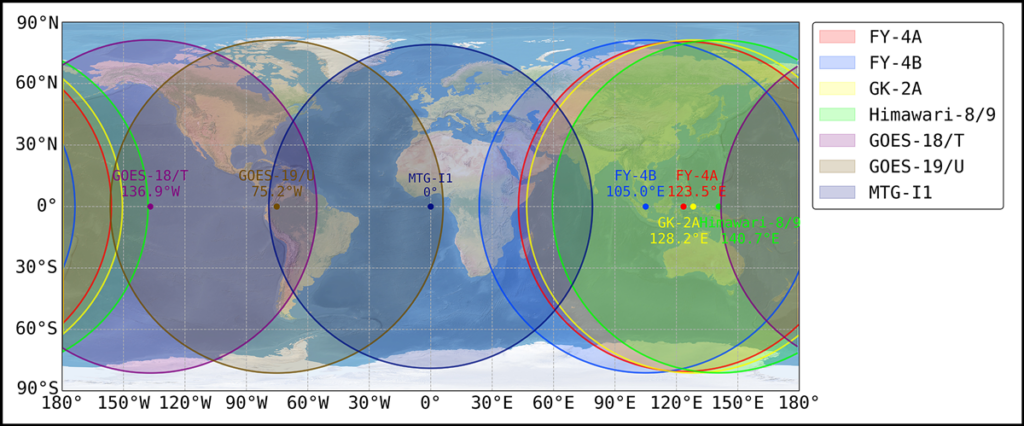
Compared with Africa, where the Meteosat Third Generation (MTG) satellite is the primary geostationary asset available, and the Americas, which rely chiefly on GOES-R, Asia has enjoyed more dense coverage from several geostationary satellites (Himawari-8 and -9, FY-4, GK-2A) in recent years, making it an ideal test bed for intersensor data comparison and harmonization.
Looking ahead, researchers and mission planners should look to collect long-term geostationary records useful for rapid land surface monitoring, to strengthen processing and calibration procedures to ensure the quality of land surface reflectance data, and to improve the integration and interoperability of datasets. With algorithms for land surface products increasingly being developed and continued missions expected (e.g., Himawari follow-ons, FY-4D/E/F, MTG expansions), geostationary satellites are poised to continue advancing understanding not only of changing weather but also of rapid land surface processes and disturbances in near-real time and over much of the planet.
Acknowledgments
X.L. is supported by a Tier 2 Academic Research Fund from the Singapore Ministry of Education (grant MOE-T2EP50222-0006). M.H., Y.Y., and K.I. are supported by the Japan Society for the Promotion of Science (JSPS) Core-to-Core Program (grant JPJSCCA20220008), the JSPS Bilateral Program (grant JPJSBP120237404), and JSPS KAKENHI (grant JP22H05004). X.M. is supported by the Fengyun Application Pioneering Project (grant FY-APP-2024.0302) and the National Natural Science Foundation of China (grant 42311540014). The authors would also like to thank Jiaqi Tian from Nanjing University for providing data on the seasonal pattern of the Himawari-8 normalized difference vegetation index in Southeast Asia, Dan Henri from Chiba University for assisting in preprocessing the MODIS dataset, Zhenduo Deng from Lanzhou University for creating the map displaying the constellation of geostationary satellites, and Shindai Kanai from Kyoto University for sharing the Dieng Plateau example with us.
References
Deng, Z., and X. Ma (2026), A frequency-based approach to improve the geometric accuracy of FY4B/AGRI geostationary satellite observations, Sci. Remote Sens., 13, 100348, https://doi.org/10.1016/j.srs.2025.100348.
Gao, S., et al. (2025), Improvement of land surface phenology monitoring by fusing VIIRS observations with GOES-16/17 ABI time series, Remote Sens. Environ., 326, 114803, https://doi.org/10.1016/j.rse.2025.114803.
Hashimoto, H., et al. (2021), New generation geostationary satellite observations support seasonality in greenness of the Amazon evergreen forests, Nat. Commun., 12(1), 684, https://doi.org/10.1038/s41467-021-20994-y.
Jeong, S., et al. (2024), GEOSIF: A continental-scale sub-daily reconstructed solar-induced fluorescence derived from OCO-3 and GK-2A over eastern Asia and Oceania, Remote Sens. Environ., 311, 114284, https://doi.org/10.1016/j.rse.2024.114284.
Li, F., X. Zhang, and S. Kondragunta (2025), First estimation and evaluation of hourly biomass burning emissions in North American high latitudes, Remote Sens. Environ., 326, 114814, https://doi.org/10.1016/j.rse.2025.114814.
Losos, D., et al. (2025), Rapid changes in terrestrial carbon dioxide uptake captured in near-real time from a geostationary satellite: The ALIVE framework, Remote Sens. Environ., 324, 114759, https://doi.org/10.1016/j.rse.2025.114759.
Miura, T., and S. Nagai (2020), Landslide detection with Himawari-8 geostationary satellite data: A case study of a torrential rain event in Kyushu, Japan, Remote Sens., 12(11), 1734, https://doi.org/10.3390/rs12111734.
Tian, J., et al. (2025), Seasonality of vegetation greenness in Southeast Asia unveiled by geostationary satellite observations, Remote Sens. Environ., 319, 114648, https://doi.org/10.1016/j.rse.2025.114648.
Wang, W., et al. (2020), An introduction to the Geostationary–NASA Earth Exchange (GeoNEX) products: 1. Top-of-atmosphere reflectance and brightness temperature, Remote Sens., 12(8), 1267, https://doi.org/10.3390/rs12081267.
Xiao, J., et al. (2021), Emerging satellite observations for diurnal cycling of ecosystem processes, Nat. Plants, 7(7), 877–887, https://doi.org/10.1038/s41477-021-00952-8.
Yamamoto, Y., et al. (2022), Uncertainty quantification in land surface temperature retrieved from Himawari-8/AHI data by operational algorithms, ISPRS J. Photogramm. Remote Sens., 191, 171–187, https://doi.org/10.1016/j.isprsjprs.2022.07.008.
Yamamoto, Y., et al. (2025), Modeling diurnal gross primary production in East Asia using Himawari-8/9 geostationary satellite data, Remote Sens. Environ., 328, 114866, https://doi.org/10.1016/j.rse.2025.114866.
Zhao, Y., et al. (2022), Evaluating the potential of H8/AHI geostationary observations for monitoring vegetation phenology over different ecosystem types in northern China, Int. J. Appl. Earth Obs. Geoinf., 112, 102933, https://doi.org/10.1016/j.jag.2022.102933.
Author Information
Xiangzhong Luo (xzluo.remi@nus.edu.sg), Department of Geography, National University of Singapore, Singapore; Misaki Hase, Center for Environmental Remote Sensing, Chiba University, Chiba, Japan; Xuanlong Ma, College of Earth and Environmental Sciences, Lanzhou University, Lanzhou, Gansu, China; and Yuhei Yamamoto and Kazuhito Ichii, Center for Environmental Remote Sensing, Chiba University, Chiba, Japan
Citation: Luo, X., M. Hase, X. Ma, Y. Yamamoto, and K. Ichii (2026), Geostationary satellite applications expand into land monitoring, Eos, 107, https://doi.org/10.1029/2026EO260083. Published on 13 March 2026.
Text © 2026. The authors. CC BY-NC-ND 3.0
Except where otherwise noted, images are subject to copyright. Any reuse without express permission from the copyright owner is prohibited.