Research & Developments is a blog for brief updates that provide context for the flurry of news that impacts science and scientists today.
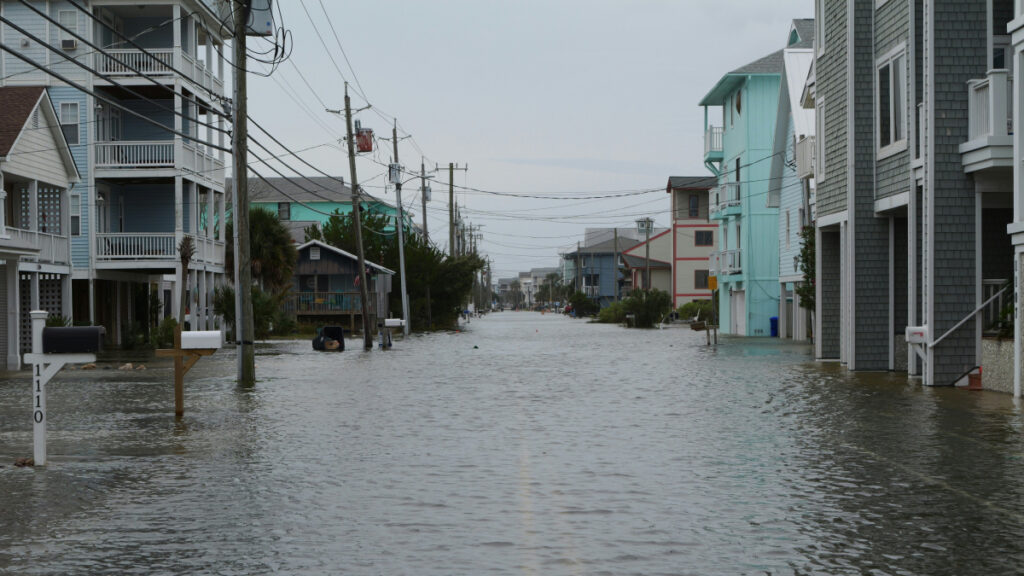
Human-driven climate change is driving the rise of sea levels, worsening flood conditions and threatening coastal communities around the world. Not only is sea level rising, but it’s rising faster every year. Understanding the degree to which different processes contribute to sea level, known as the sea level budget, can help scientists better predict where and how quickly sea level will rise under potential climate futures.
But for several decades there has been a “budget gap” between measurements of sea level change and the total estimated contributions from glaciers, polar ice, land storage, and oceans expanding as they heat up (thermospheric expansion). Research published today in Science Advances has helped close that budget gap by incorporating more recent sea level observations, reconciling measurements taken by different instruments, and including recent community estimates of sea level rise and its components.
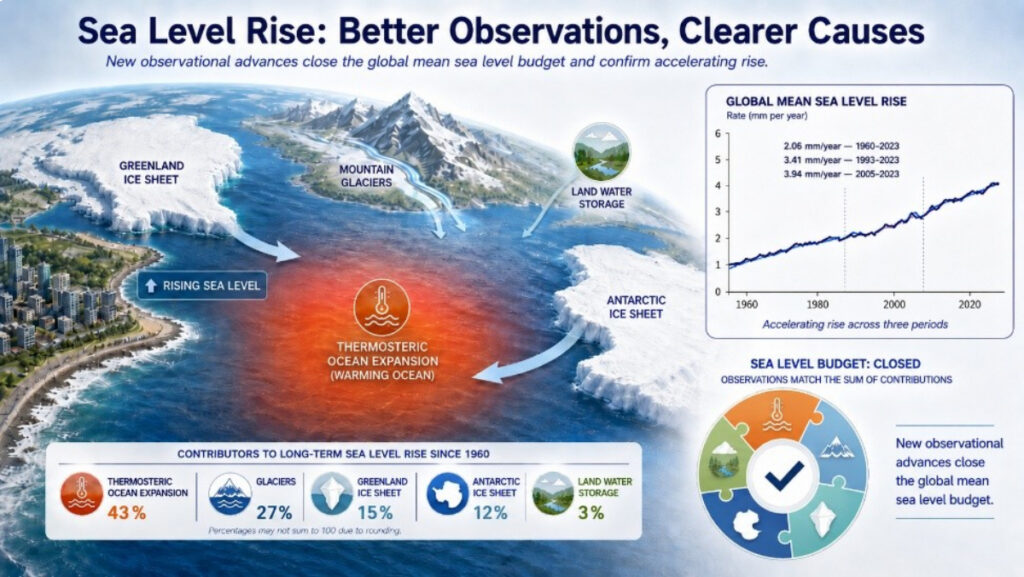
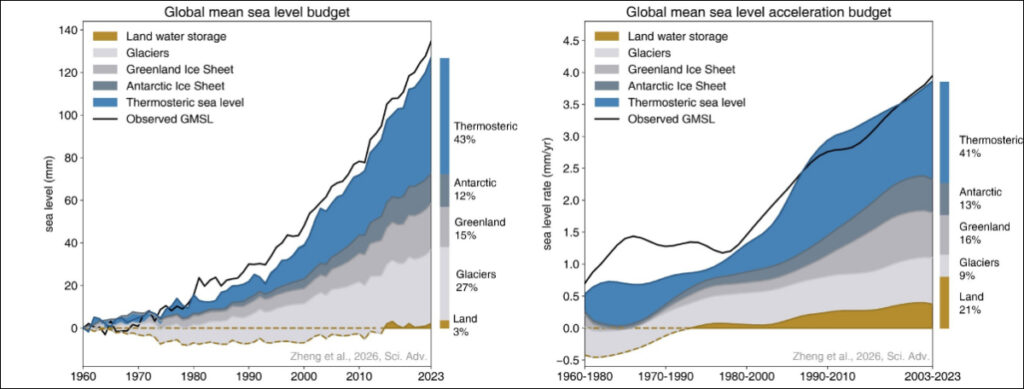
The new analysis breaks down the drivers of sea level rise from 1960 to 2023. The team found that the largest contributor is heat-driven expansion of seawater, responsible for 43% of sea level rise since 1960. Melting ice contributed the next largest amount of sea level rise: 27% came from mountain glaciers, while 15% came from the Greenland Ice Sheet and 12% from the Antarctic Ice Sheet. Lastly, sea level rose 3% as land reduced its capacity to store water.
“For years, there has been a frustrating gap between how much the oceans were observed to be rising and how much we could explain from the individual causes,” John Abraham, an engineer at the University of St. Thomas in St Paul, Minn., and a coauthor on the new research, said in a press release. “This work shows that, with better instruments, processes, and smarter analysis, this knowledge gap can be closed. We can explain sea level rise with greater confidence.”
The researchers also calculated the rate at which sea level has risen since 1960 and how each component factored in. They found that the rate of sea level rise has recently doubled: It was 2 millimeters per year averaged over 1960–2023 and 4 millimeters per year averaged over just 2005–2023. The strongest driver of that doubling is ocean warming, responsible for 41% of the accelerating rate of sea level rise, followed by reduced land water storage (21%).
This research demonstrates the importance of maintaining detailed records of sea level rise, collecting new measurements, and not backing away from global change research. With better data on which processes contribute to sea level rise and its acceleration, policymakers and local communities can create informed mitigation strategies that account for future rise.
—Kimberly M. S. Cartier (@astrokimcartier.bsky.social), Staff Writer
These updates are made possible through information from the scientific community. Do you have a story about science or scientists? Send us a tip at eos@agu.org.

Text © 2026. AGU. CC BY-NC-ND 3.0
Except where otherwise noted, images are subject to copyright. Any reuse without express permission from the copyright owner is prohibited.