The simple supply-and-tax math that makes California sky-high and Oklahoma dirt cheap
Gas prices aren’t numbers on a sign — they’re a national mood swing. Pull into a California station and you’ll feel your wallet flinch: $4.60 a gallon, easy. Cross a few state lines into Oklahoma, and suddenly gas feels almost cheap again. That gulf between pain and relief isn’t random. It’s built into the American fuel system — a mix of refineries, state taxes, boutique fuel blends, and geography that quietly decides who gets squeezed and who cruises.
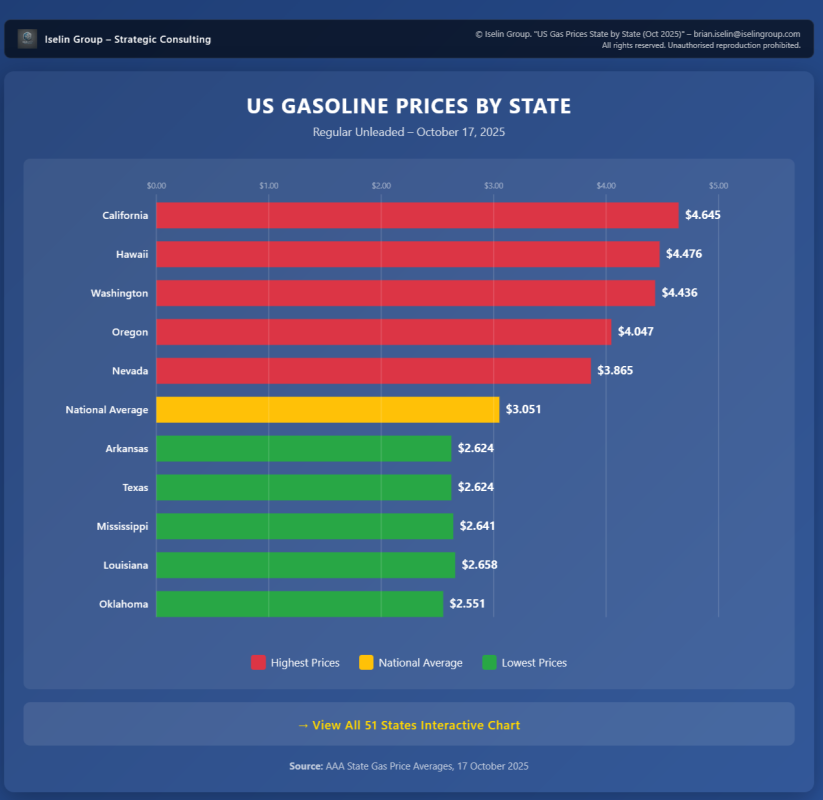
The national average sits at $3.05 per gallon, but the spread is huge. Click to view the full chart of all 51 state averages (October 17, 2025).
West Coast Premium, Plain English
The West Coast sits in its own supply bubble. Refineries there don’t connect to the rest of the country with big pipelines, so backup supply stays limited. When a plant goes down for maintenance, prices jump and stay high because there’s not much spare capacity to cover the gap. Federal data groups the West as “PADD 5” and shows fewer refineries and less slack than the Gulf Coast, which keeps a built-in premium.
California layers on top of that. The state runs cap-and-trade for carbon and the Low Carbon Fuel Standard (LCFS), both of which add cost at the wholesale level. California also uses its own cleaner gasoline blend. Few refineries outside the region make it, so emergency supply options stay thin. Then you add one of the highest state fuel tax and fee loads in the country. Stack those factors and California usually tops the board.
Why the Middle of the Map Stays Cheap
Look at the low end and a pattern pops: Oklahoma, Arkansas, and Texas sit close to the nation’s largest refining hub along the Gulf Coast. More refineries and shorter delivery distances mean cheaper wholesale gasoline and fewer price spikes when one plant has trouble. Those states also tend to levy lower fuel taxes. More supply, less tax, shorter trip to your tank—that combo wins.
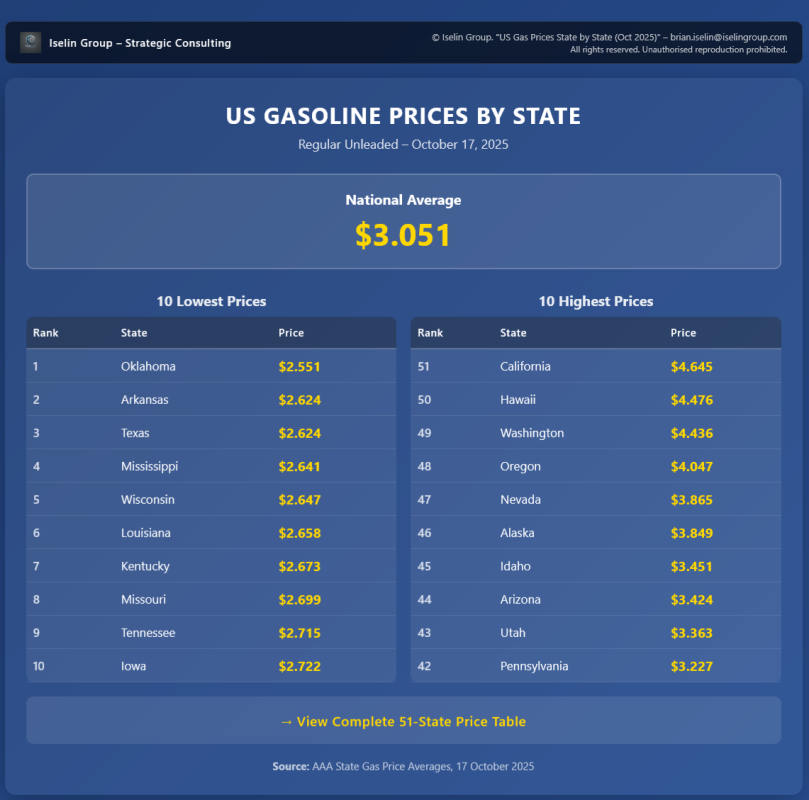
California leads the pack, with Washington, Oregon, and Hawaii not far behind. Click to view the full table of average gas prices by state (October 17, 2025).
The National Average Hides the Real Story
A national average around the low-$3s sounds fine, until you hit a regional outlier. Hawaii runs high because nearly everything ships in. Nevada, Oregon, and Washington track behind California because they share that West Coast supply bubble. Meanwhile, drivers across much of the Midwest and South buy gas well under the national line. For road-trip math, local beats national every time.
Gas vs. Diesel vs. EV
Regular unleaded still costs less than diesel in many states, especially out West, where diesel demand and refining constraints keep prices elevated. If you’re cross-shopping an EV, the cost per mile can win in places with cheap electricity, but the pump still rules for quick refills and long stretches between stops. Your budget depends on local gas prices, local power rates, and how you drive.
What Drivers Should Watch
Three things move prices fast: refinery maintenance (spring and fall), hurricane season in the Gulf, and state tax changes at budget time. If you track those and check a daily state-level average from a trusted source, you’ll plan smarter fuel stops and avoid the steepest spikes.
The headline number on TV won’t tell you what your next fill-up costs. Your zip code will.