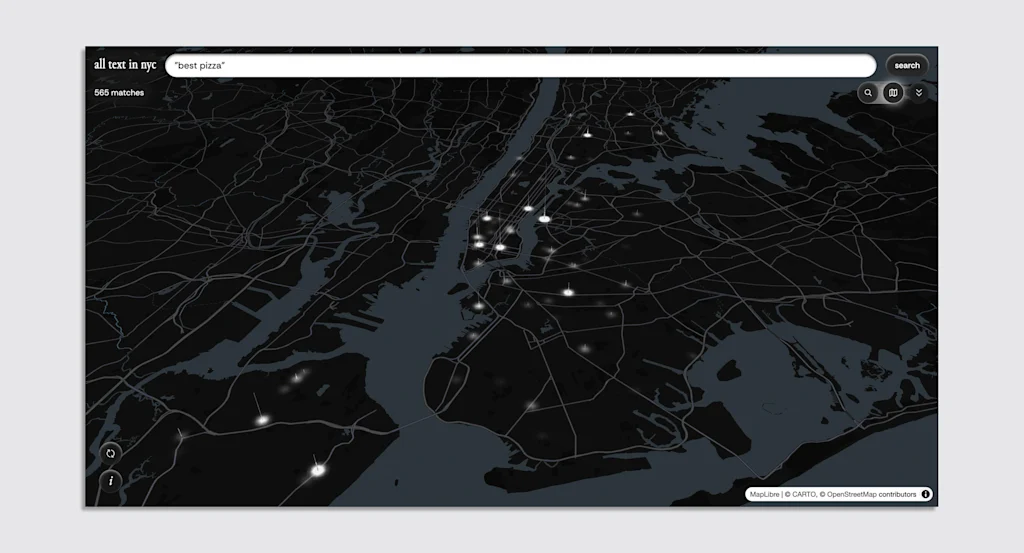
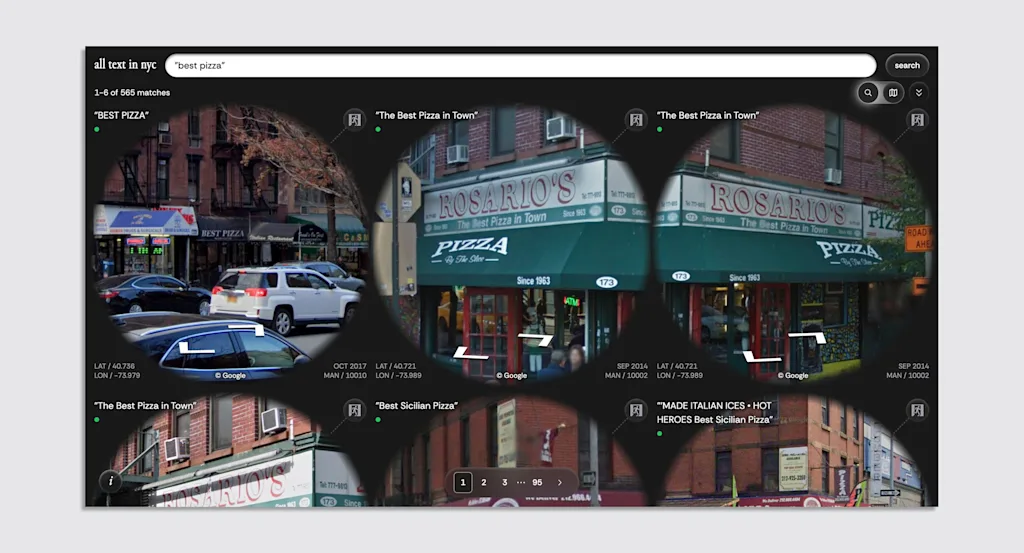
There are 565 “best pizza” spots in NYC. Junior’s Cafe in Queens has the “best pizza in town.” As does Rosario’s in Lower Manhattan, and Big Daddy’s Pizza in Brooklyn. At least that’s the case, according to the establishments’ respective signs.
We know this because Brooklyn-based artist Yufeng Zhao has built a searchable database of all the words across the New York City streetscape. Think of it as a search engine for every visible word that’s appeared on streets, storefronts, buses, or construction fences in the city, since 2007, when Google Street View launched.
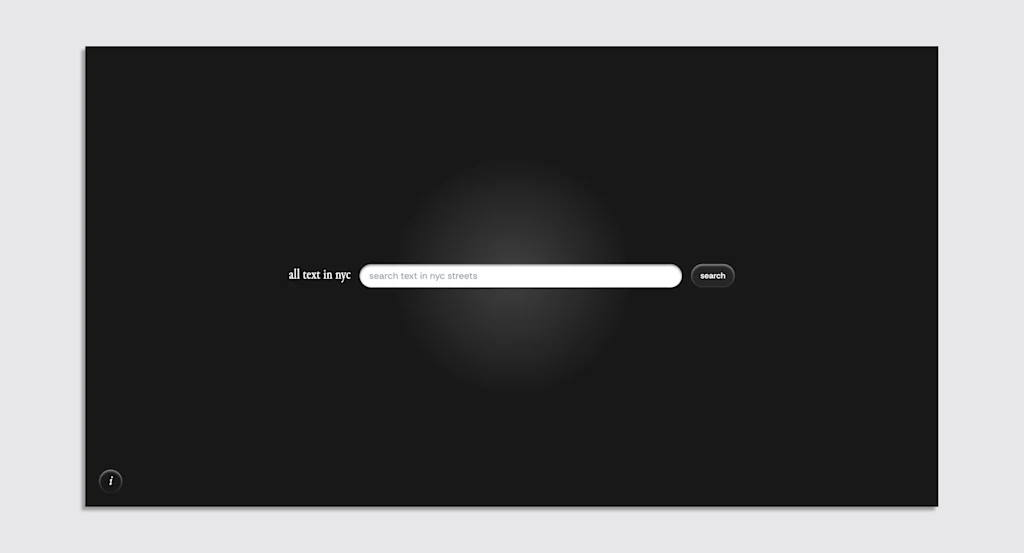
The result is a linguistic map of the city that never sleeps, distilled from 17 years of Google Street Views, and more than eight million images. The database includes everything from business signs and street signs to flyers posted on windows, and even recognizable graffiti.
And the verdict is clear: New York City is a city of “bests.”
“A lot of restaurants claim they have the best pizza or the best restaurant,” Zhao says with a laugh.
A time capsule of NYC
A city is a palimpsest. New flyers replace old flyers. Businesses die; shiny signs go up. VC-funded coffee shops erase self-made mom-and-pop shops.
All Text NYC, as the search engine is called, launched in December 2024, which means it hasn’t yet caught up with the Zohran Mamdani poster craze. Nor has it seen the billboard ads for this year’s Tony Award winning musical Maybe Happy Ending.
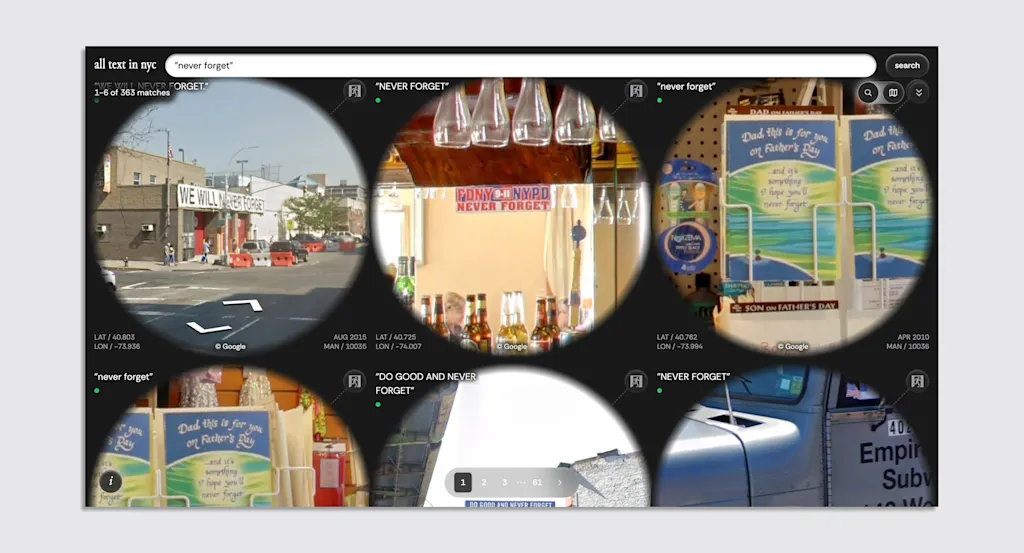
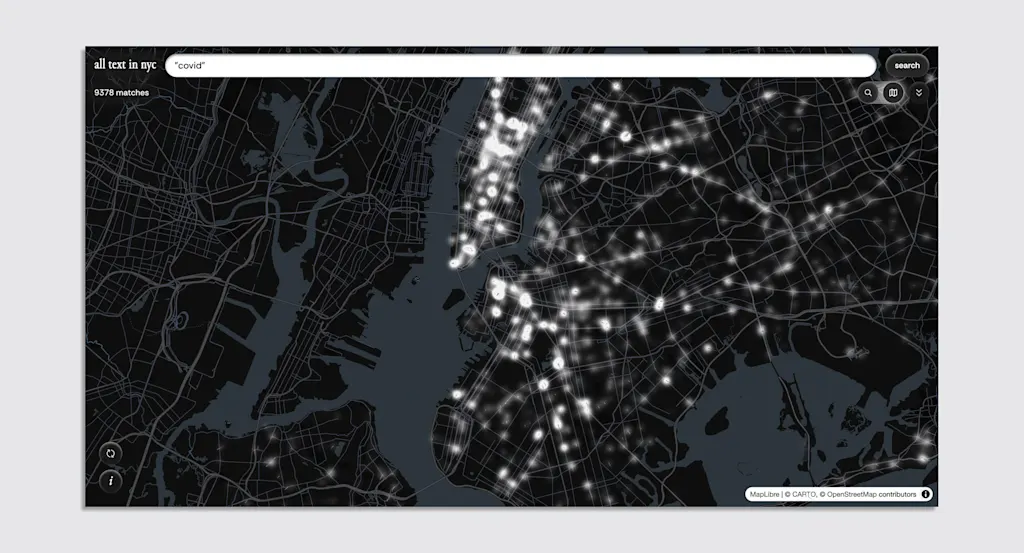
But if the city remembers, so does its search engine. For Zhao, All Text NYC is a time capsule of the city between 2007 and 2024, and the data supports it. “Never forget” shows up 363 times while “Covid” appears close to 10,000 times.
There is a lot to learn from the words that make up a city, especially when it is as verbose as the Big Apple. Zhao, who recently moved from Brooklyn to Cambridge, Massachusetts, to pursue a Masters of Media Arts and Sciences at MIT, identified a whopping 138 million snippets of text in the city. He thinks the number would be significantly lower in Cambridge, and likely higher in Shanghai, where he grew up.
A vast majority of the top 10 most frequently used words are related to parking: “stop,” “one way,” “no standing,” “no parking.” Traffic aside, the word “deli” is high up on the list, as is “ATM,” and “Fedex” and a certain A/C company called Fedders that appears almost 60,000 times.
The database lets you search individual words and word combinations (like “best pizza”). You can see the results through images where the words appear, as well as on a heat map of New York City. “Sabrett,” the hot dog brand, lights up most in Manhattan, especially in Times Square. While “preschool” is most prevalent in Lower Manhattan and Brooklyn.
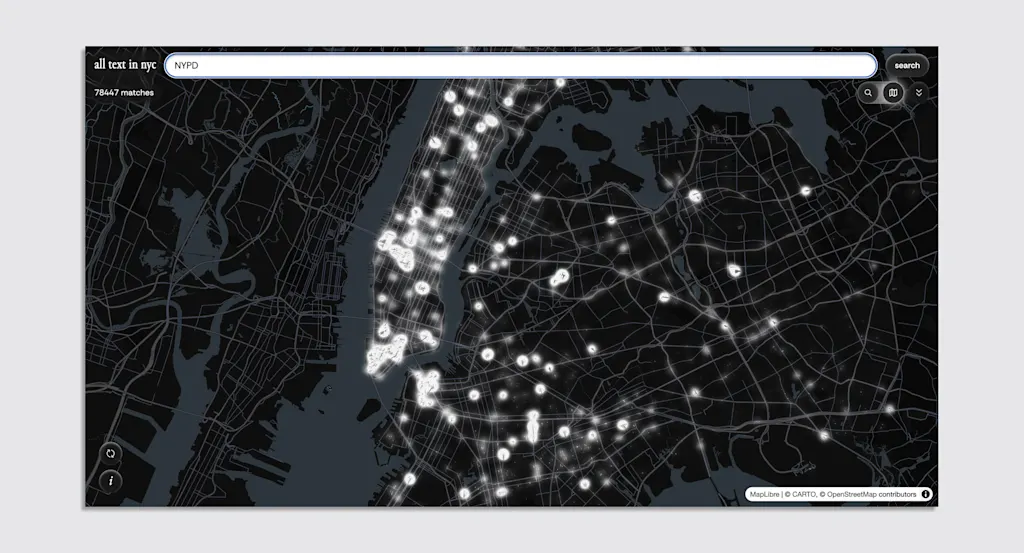
Sometimes, it’s more interesting to see where certain words do not appear. Take “NYPD,” for example. The word appears almost 80,000 times. It lights up a little everywhere, but wealthy, predominantly white neighborhoods of the city—like the Upper West Side, the Upper East Side—as well as the outer boroughs remain unmistakably dark. (Meanwhile, the map around Midtown and the World Trade Center is glowing in white.)
Google takes photos every year at the same location, so Zhao points out the map is not necessarily representative of where NYPD goes on any given day, but when you accumulate the data as he has over the past 17 years, you begin to notice patterns. “There are certain neighborhoods where NYPD is almost never captured,” he says.
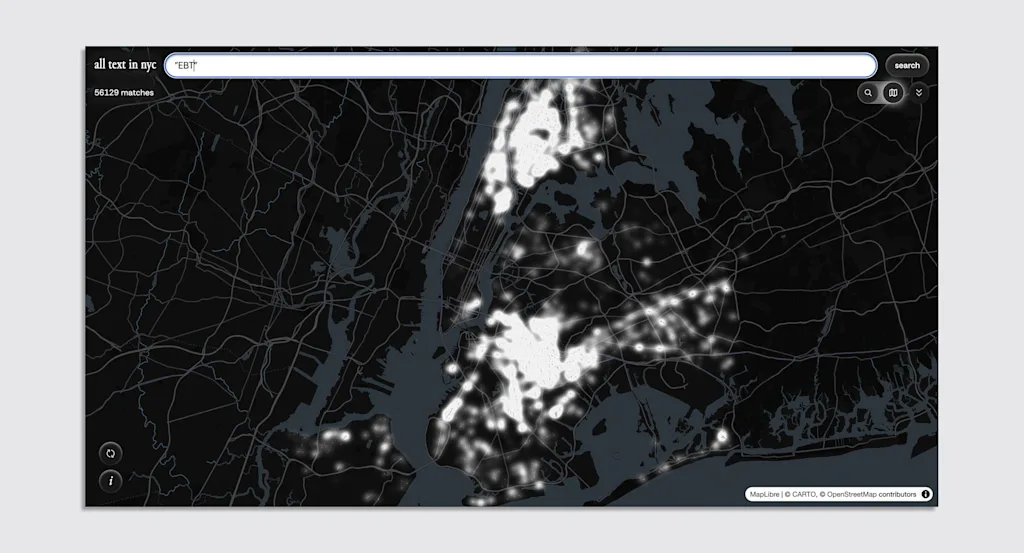
A similar pattern shows up for businesses that accept food stamps. The word “EBT” (for Electronic Benefit Transfer) shows up more than 56,000 times, but the map highlights how big of a desert Manhattan is on that front. Parts of Brooklyn, including the now-gentrified-beyond-recognition neighborhood of Williamsburg, are also conspicuously dark. Of course, low-income people do live in Manhattan, which highlights just how far they might have to travel to reach a grocery store that serves their income level.
An underutilized resource
When Google Street View first launched, it allowed people to virtually explore any location, creating a 360-degree map of the world. Over the years, it has been used for navigation, real estate research, and virtual travel during COVID, but for Zhao, it remains an underutilized resource. “It’s such a vast dataset,” he says, “The images contain so much data.”
In 2018, the research collective Slab used Google Street View to create Culture Map, a cultural and ethnic map of Los Angeles. By mapping the city’s signs, posters, and flyers, they found 58 different culture hubs, which they noted was far more than those officially designated by the city.
Slab’s algorithm, which folded in data from eight years (from 2011 to 2018) could detect many languages. For technical reasons, Zhao could only use languages that use the Latin alphabet, which means that areas like Chinatown, Little India, or the Eastern European enclave at Brighton Beach might not be fully represented.
Still, the platform could become a goldmine for researchers, policymakers, urban planners, anthropologists, or anyone interested in the fabric of a city, and the patterns that only become visible when we listen to our streets and storefronts speak.
Zhao says he plans to update the database at the end of every year. What will the city tell us then?