Methane is one of the most abundant greenhouse gases on Earth, and, when compared with carbon dioxide, it is 28 times more potent at trapping heat in the atmosphere.
As the climate warms, it’s increasingly urgent to understand where methane comes from. Researchers can analyze the ratios of different carbon isotopes within methane to learn whether that sample came from fossil fuels or from other sources, such as wetlands or agriculture.
“I think this could end up being a landmark study.”
Sometimes, though, even these isotopic fingerprints leave room for uncertainty. New research examined several hundred liters of air gathered from compacted snow in Greenland in an even more precise way. The study, which marks the first time researchers have reconstructed the clumped isotopologue signature of atmospheric methane from past air, was published today in Science Advances.
“I think this could end up being a landmark study,” Edwin Schauble, a geochemist at the University of California, Los Angeles, who was not involved in the research, told Eos via email. “Methane is such an important greenhouse gas and tracer of the carbon cycle that the prospect of getting a better understanding of its history and future is exciting.”
The Nitty-Gritty
Methane (CH4) is made up of one carbon and four hydrogen molecules.
Isotopes, of course, refer to atoms of the same chemical element that have different numbers of neutrons. For instance, carbon naturally occurs in three isotopes: carbon-12, carbon-13, and carbon-14, with carbon-12 being the most common. Hydrogen has three naturally occurring isotopes, including deuterium (which has one proton and one neutron).
The word “isotopes,” explained Jiayang Sun, a geochemist who was a Ph.D. student at the University of Maryland when he coauthored the new paper, refers to elements at the atomic level.
“But when we say ‘isotopologue,’ it’s a word on the molecular level,” he said. “For clumped isotopologues, it’s two or more rare isotopes substituted into one molecule.”
This could mean that the carbon-12 in a methane molecule is replaced with a carbon-13 and one of the molecule’s hydrogens is replaced with deuterium, or it could mean that two of the hydrogens in the same molecule are replaced with two deuteriums.
“In some cases, the information from clumped isotopologues gives you information that’s independent from that provided by the straight isotopes,” said James Farquhar, a geochemist at the University of Maryland. “It gives us a little bit of a better understanding, or better constraints.”
Higher anthropogenic emissions result in lower clumped methane concentrations. However, clumped methane molecules take many years to reach equilibrium, so an increase in methane emissions might not show up in the clumped isotope signal for decades.
New Insights from Old Air
Modeling reflects that emissions of methane have changed over the course of the industrial era. NOAA data show that atmospheric methane levels have risen since the 1980s, with a plateau from 1999 to 2006. The new study’s researchers wanted to take a closer look at these changes by examining the clumped isotopes in air samples from the past.
“The overall trend is kind of clear, but when it comes to detailed allocation of total emissions to each source…the uncertainties related to that are still high,” Sun said.
Because methane makes up only about 2 parts per million of air, and clumped isotopes only represent part of that, the team would need a lot of air to undertake this investigation.
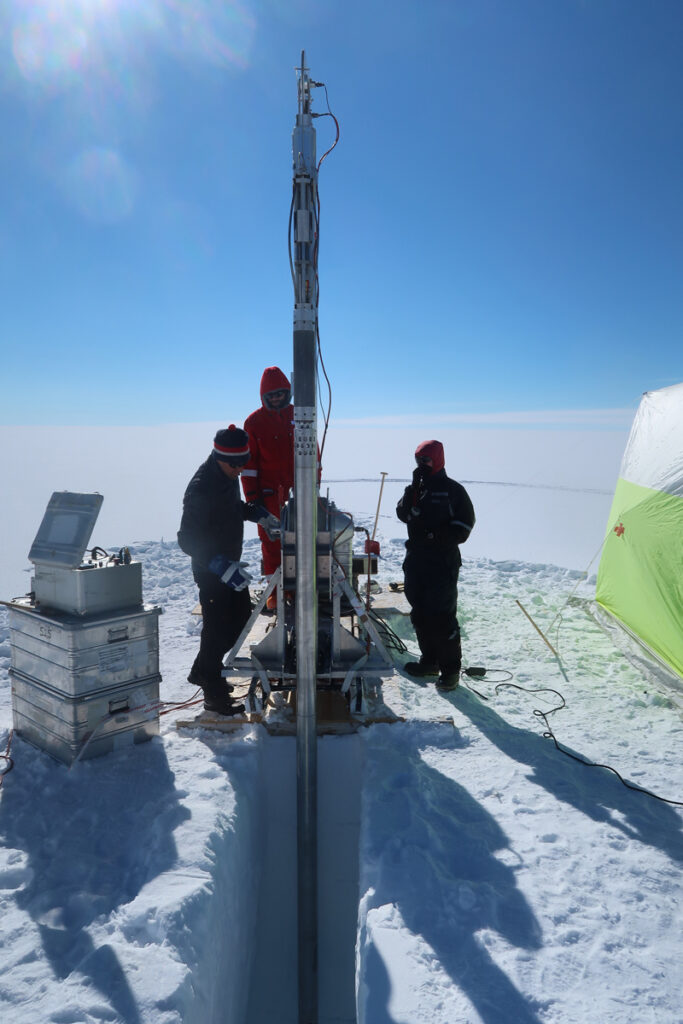
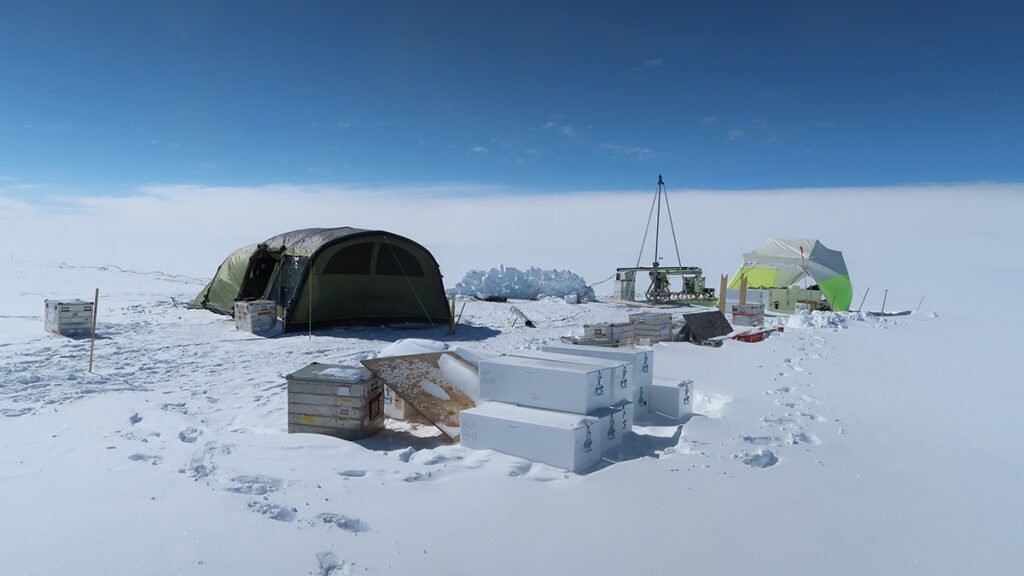
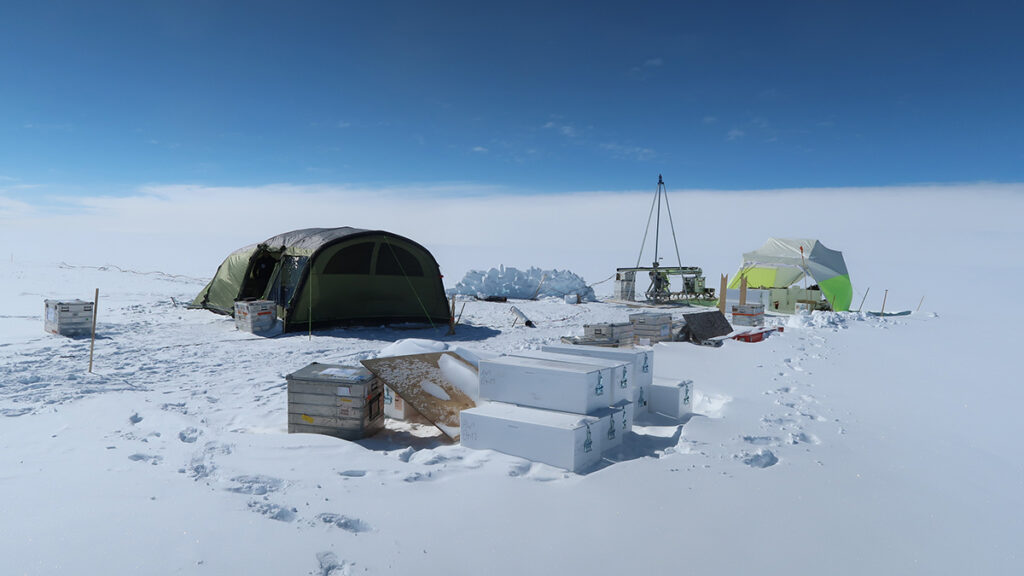
But where do you get several hundred liters of decades-old air? One method is to use air found in firn, compacted snow that is the intermediate stage between snow and glacial ice. Researchers from Utrecht University, including atmospheric scientists Malavika Sivan and Thomas Röckmann, happened to have several hundred liters on hand.
The samples were gathered in 2018 as part of the East Greenland Ice-Core Project (EastGRIP). A team of researchers, including Röckmann, drilled a hole into the ice and inserted a 5-meter-long bladder and a set of three tubes. The bladder was inflated to seal the hole and prevent contamination. The tubes then pulled 30-year-old air out from the pores within the firn and pumped it into containers on the surface.
The Utrecht team was interested in examining the clumped isotope levels, but they didn’t have a mass spectrometer that could conduct such analysis on their relatively limited sample size. This made the University of Maryland researchers, who had the spectrometer but not the samples, a perfect partner.
After measuring the samples, the team used modeling to conclude that clumped methane reached a low in approximately 1993.
“Our model suggests that was caused by the increased anthropogenic methane emissions during the industrial period (the 1800s),” Sivan wrote in an email to Eos. “Clumped methane molecules take a very long time to equilibrate after such perturbations, hence the lag in the signal.”
Future Methane Levels
By helping us understand more about our past, this work could be combined with traditional bulk isotope measurements to improve modeling of future atmospheric methane levels.
“Not only do their results tell us much more about methane’s past history, their findings may also be very helpful in targeting pathways to bring methane’s rise under control.”
“It provides the data that would be needed to understand how we got here in terms of the isotopic compositions, and that’s a constraint that will be of value if we’re going to make interpretations about changes that happen in the future,” Farquhar said.
Euan Nisbet, an Earth scientist and professor emeritus at Royal Holloway University of London, said that clumped isotope research is “very much the forefront” of improving understanding of the global methane budget, and that this new work is “a very fine study.”
“Not only do their results tell us much more about methane’s past history, their findings may also be very helpful in targeting pathways to bring methane’s rise under control,” he said.
—Emily Gardner (@emfurd.bsky.social), Associate Editor
Citation: Gardner, E. (2026), These “clumped” molecules could offer clues about Earth’s climate, Eos, 107, https://doi.org/10.1029/2026EO260235. Published on 15 July 2026.
Text © 2026. AGU. CC BY-NC-ND 3.0
Except where otherwise noted, images are subject to copyright. Any reuse without express permission from the copyright owner is prohibited.