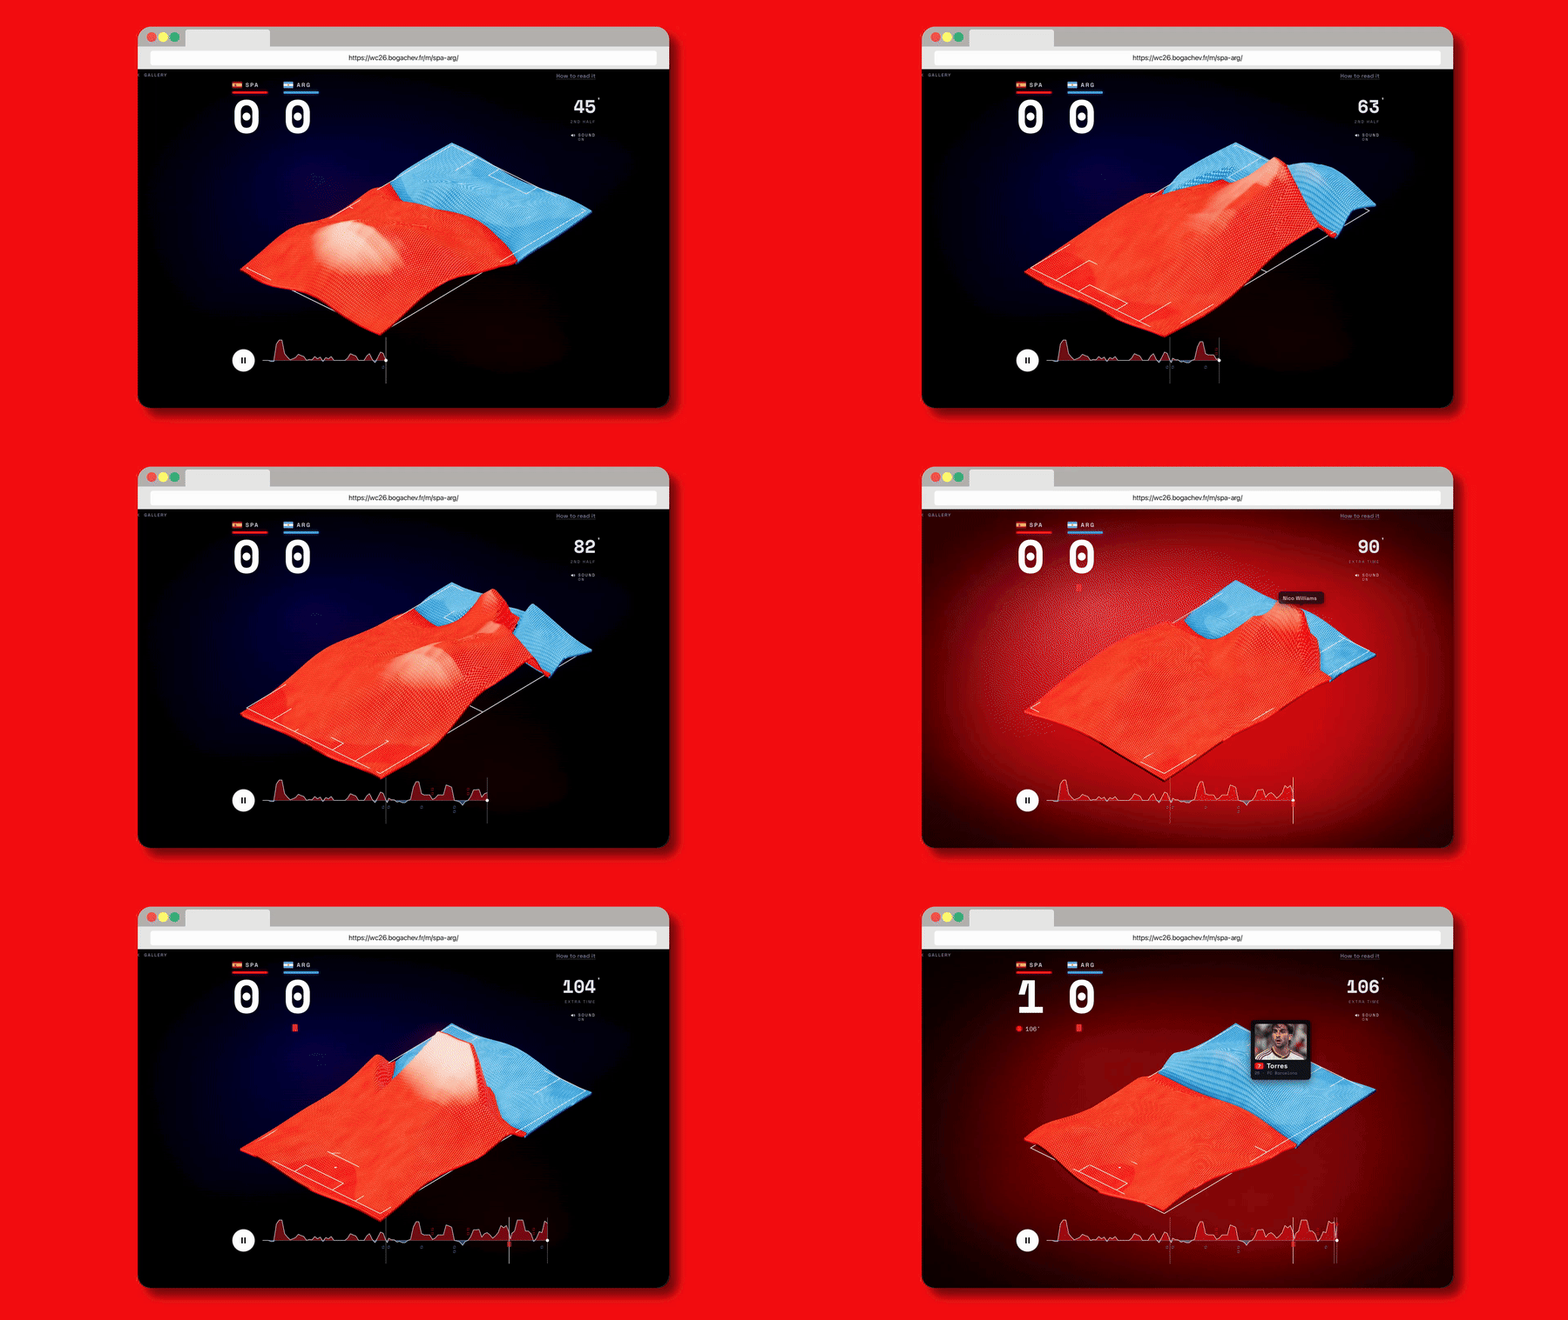
Spain dominated the ball and occupied the entire pitch at MetLife Stadium during the World Cup final against Argentina. It didn’t matter that Messi’s teammates fouled, elbowed, and used every trick to slow the Spaniards down and force the game to penalties. La Roja was so overwhelmingly better that they outshot Argentina, 20 to 2, across the full 120 minutes; Argentina became the first finalist in World Cup history to fail to register a single shot in regulation time.
But if all this soccer talk sounds foreign, let some visuals do the explaining. A 3D animation by data visualization expert Alexandre Bogachev shows Spain’s absolute control of the game in a way anyone can understand. It’s part of his “Football Data Portraits” series, which covered all 2026 World Cup matches.
Bogachev’s work turns each World Cup match into something closer to a piece of generative functional art: an undulating, cloth-like 3D topography that ripples and buckles in real time as the game unfolds. The goal, he explains on the project’s website, is to capture the emotion of a match rather than just its raw numbers.
Each of these scenes is built from roughly 1,500 individually logged actions per match—passes, fouls, shots, cards—all pulled from real match telemetry, with nothing AI-generated. The platform also plays with time itself, running in what Bogachev calls “dramatic time”: It compresses the dull midfield sequences and slows down time to the instant a scoring chance materializes to appreciate the drama of the moment.
How it works
Under the hood, the visualization runs on Three.js, the widely used JavaScript library for WebGL 3D graphics. The fabric-like texture of the team “blankets”—red for Spain and blue for Argentina—is rendered through custom shaders. To prevent the animation from flickering when the ball changes teams for a second, Bogachev runs the underlying momentum data through something called a low-pass filter, basically a mathematical function that smooths sudden spikes with no real impact on the game, so the cloth flows rather than convulses.
The visualization stacks five distinct data-driven elements. The foundation is the two red and blue blankets showing which team controls which zone of the pitch. This data is sourced from FotMob, the live football data platform widely used by broadcasters and analysts for real-time match statistics. This includes the ball possession and momentum feeds, the way the game is going for the dominating team.
As the match progresses, the terrain rises into peaks that track every shot attempt, with the height calibrated to expected goals—something called “xG” in football terms. This data comes from a sports data company called Opta, which is the analytics backbone for professional football leagues and federations across the world.
When a goal is scored—Spain scored three, though two were disallowed—the visualization triggers something called “goal flood effect,” which washes the entire field in the scoring team’s color.

Running continuously beneath this main landscape is a lower pulse, a seismograph-style timeline at the bottom of the screen that charts the game’s overall momentum using FotMob’s live data feed. The entire visualization also uses an ambient sky that acts as a subtle background cue, shifting the horizon’s color to reflect whichever team currently holds the psychological upper hand.
Watching the Spain-Argentina final rendered this way shows the Spaniard’s monopoly of the ball, with their blanket swallowing most of the pitch at almost all times. Again and again, the terrain deep in Argentina’s defensive third turns into a mountain range of shot attempts and xG peaks, while the ground near Spain’s own goal stays essentially flat and undisturbed.

The goal flood never triggered for La Albiceleste because they never scored, only attempting two shots on goal that didn’t even require Spanish goalkeeper Unai Simón’s intervention. The sky tilts overwhelmingly toward Spain for nearly the entire match, as if the atmosphere itself had picked a side, a good metaphor of how most of the world interpreted the game.
Bogachev’s visualization shows the pureness and beauty of football in a way that the final 1-0 score couldn’t possibly show.